Workforce Analytics
Get action steps from your workforce analytics
We make complex data simple to understand - visualize key metrics, identify patterns, and drive smarter planning decisions
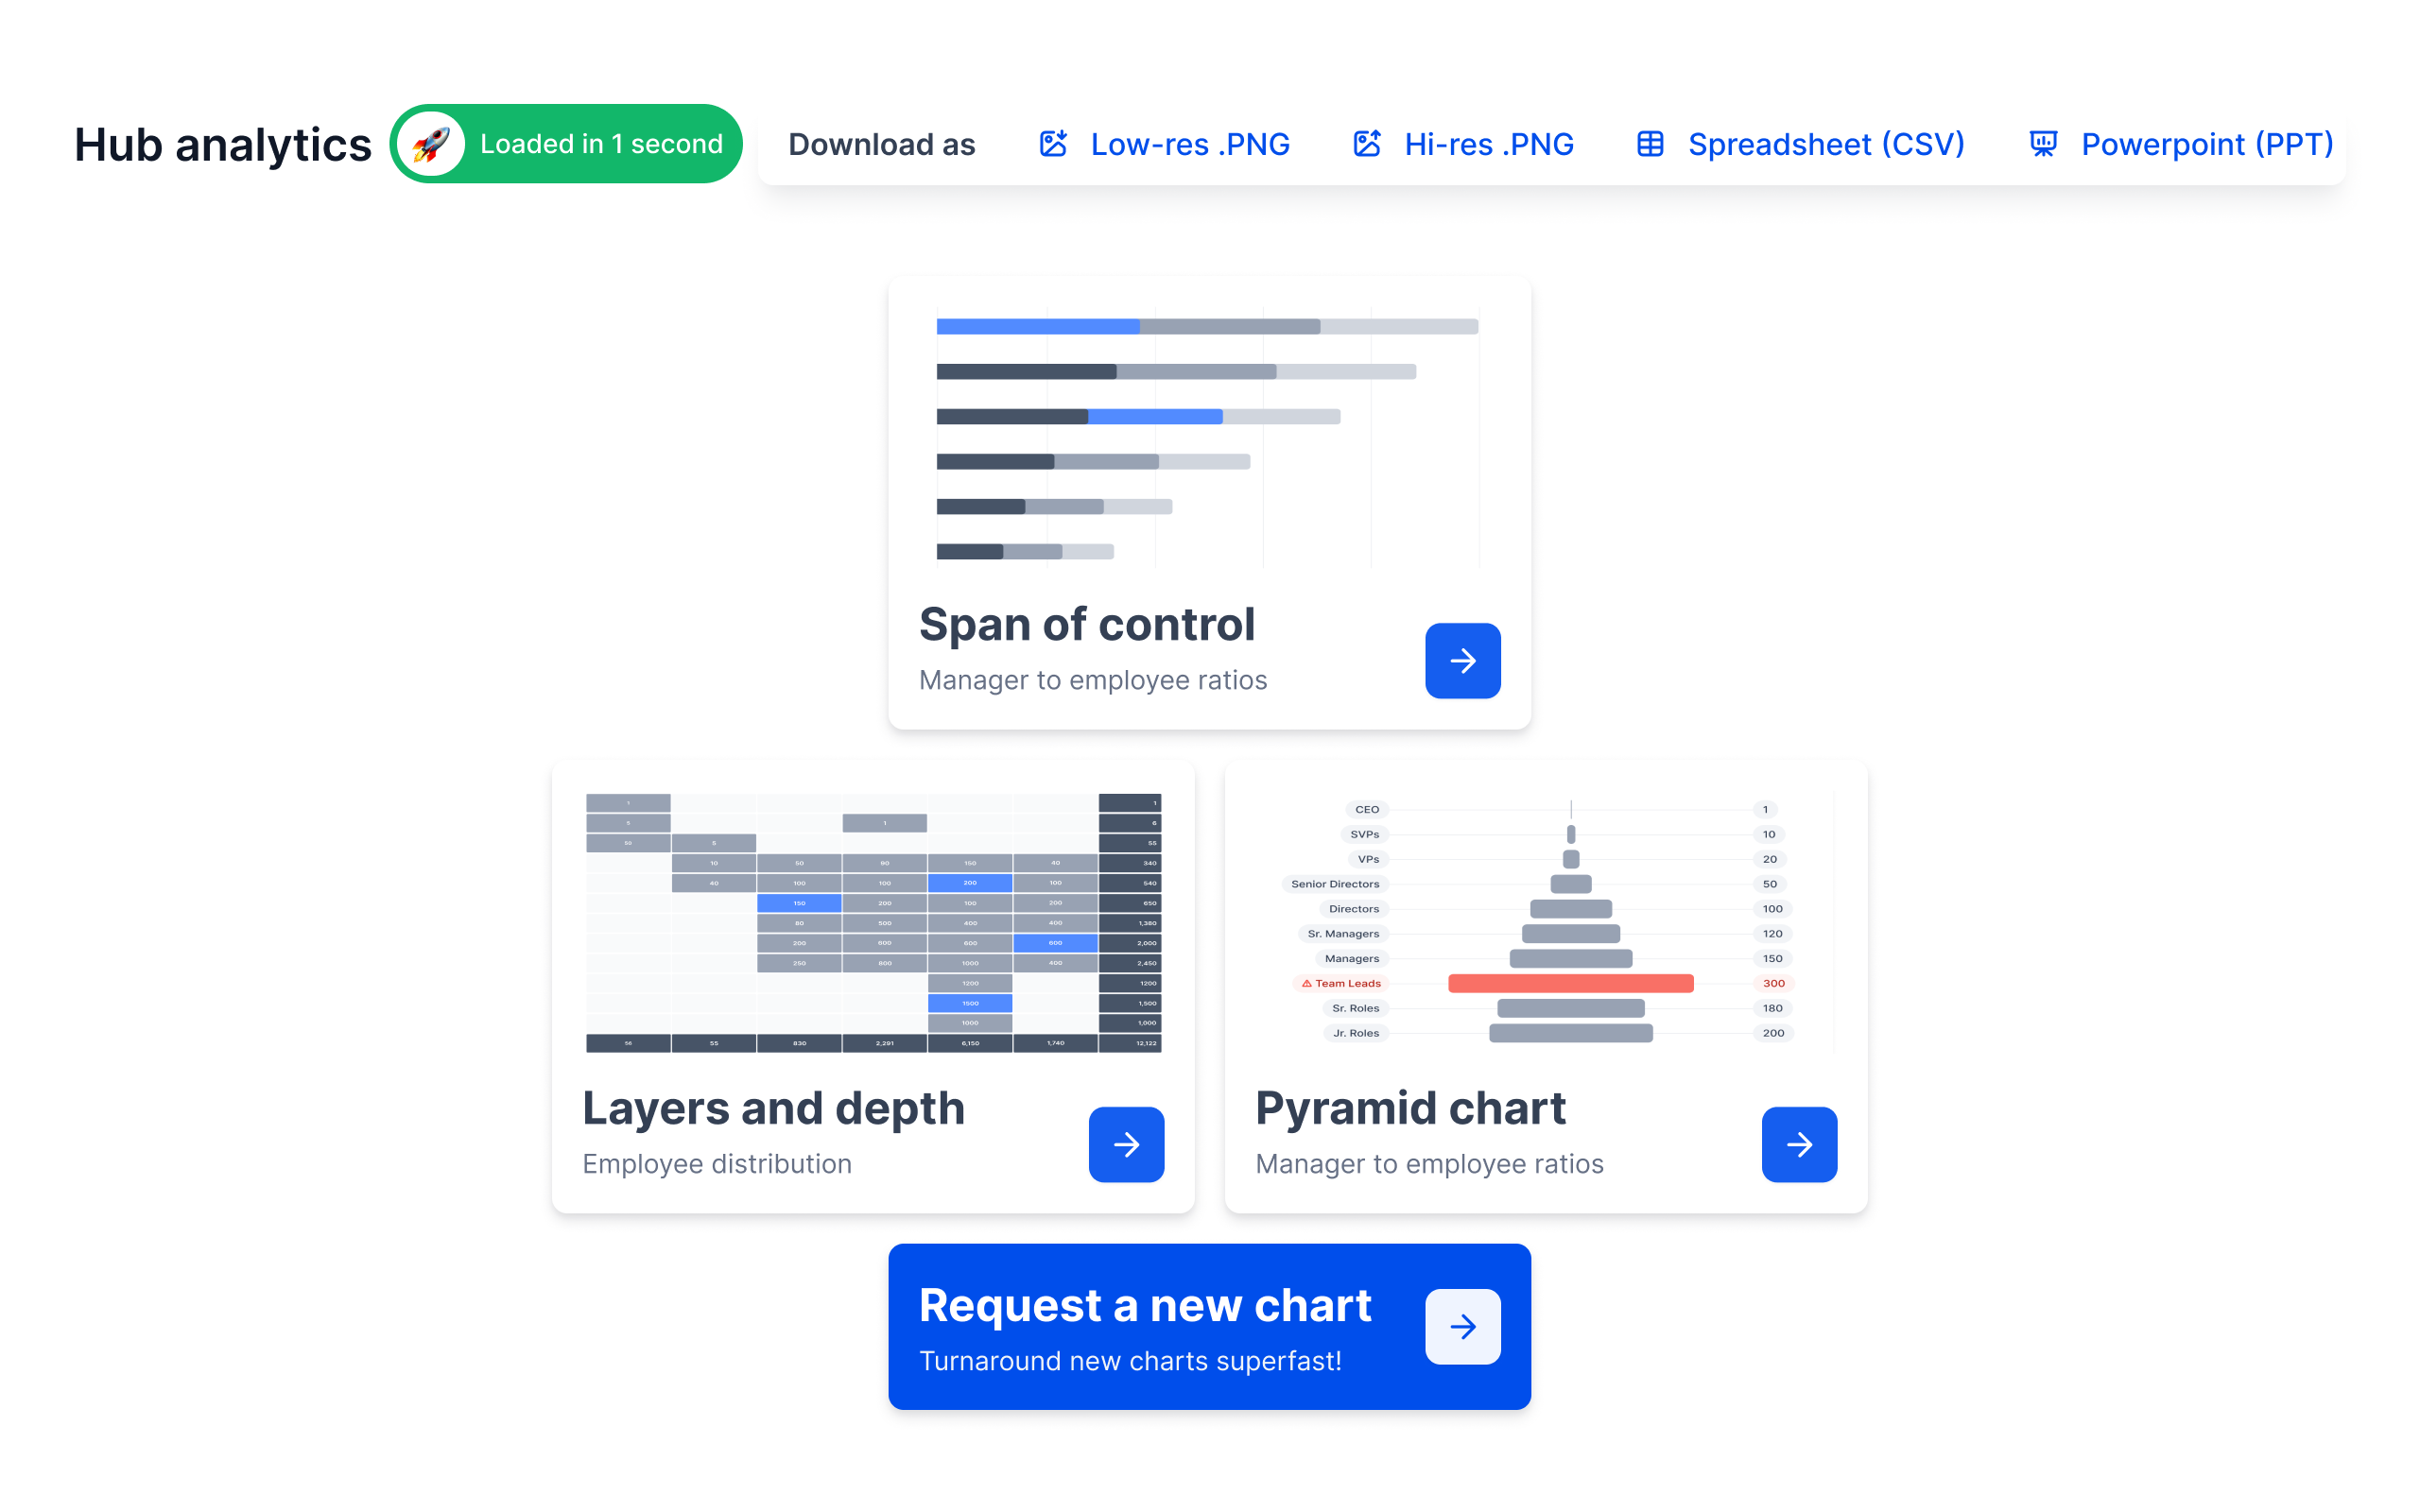
Visualize Key Metrics
Get clarity on org performance
Visualize key metrics like cost, productivity, and structure with intuitive charts. Gain the insights you need to optimize workforce efficiency and drive smarter planning.
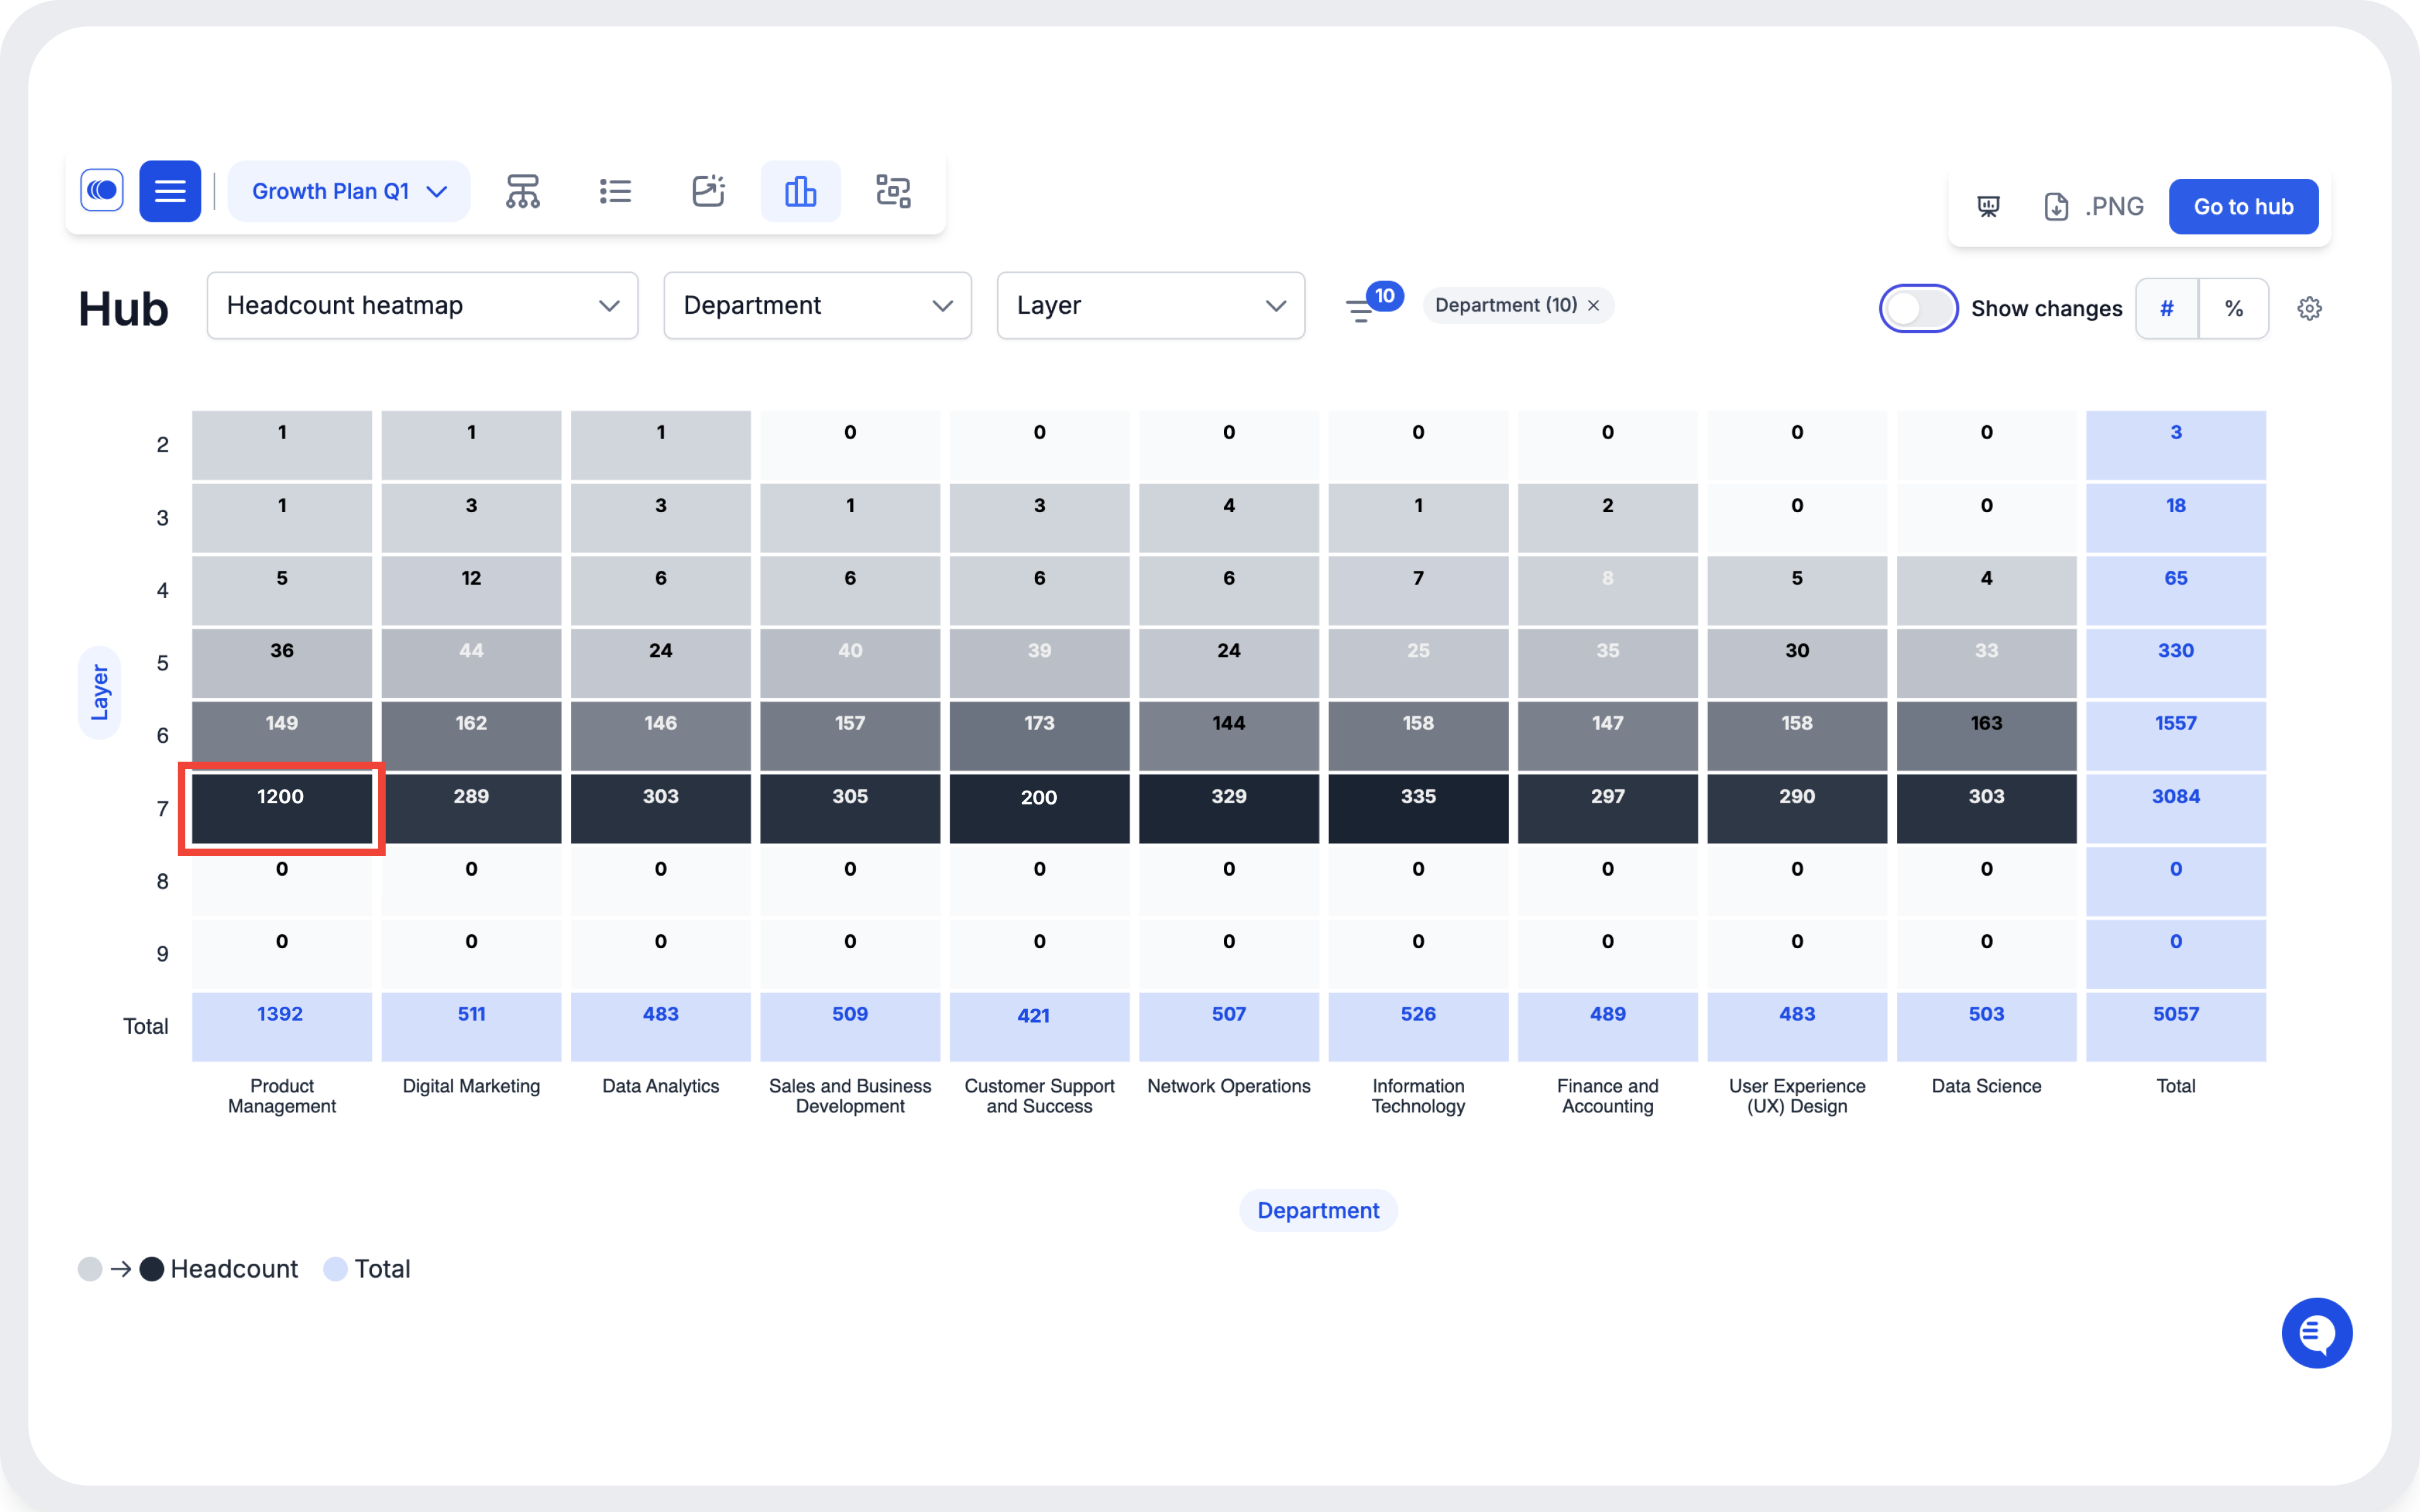
Identify Patterns
Find what matters fast
Use flexible filtering and drill-down tools to see trends and anomalies in your workforce data. Customize views to see exactly what you need.
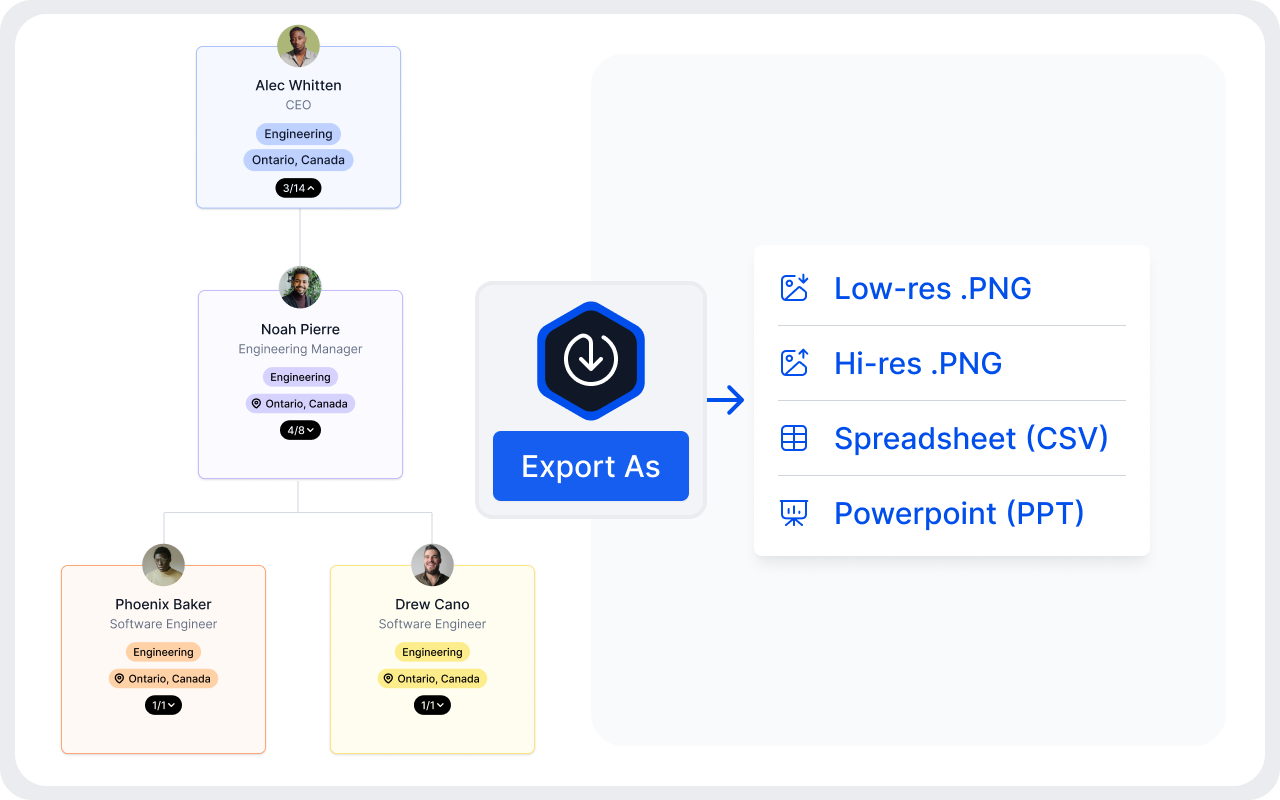
Export Key Takeaways
Share accurate insights
with stakeholders
Export visualizations directly to ppt or as images. Share clear and professional insights with stakeholders in one click.
FAQs
Workforce Analytics
Workforce analytics goes beyond reporting - it connects data across roles, teams, costs, and structure to highlight how your organization is performing and where it needs to improve. Unlike traditional reports, Agentnoon’s workforce analytics software surfaces patterns that help HR and leadership make real-time, informed decisions that drive workforce planning forward.
Agentnoon makes complex org data easy to interpret. With visual insights into key metrics like productivity, structural cost, and team distribution, you don’t need a background in analytics to spot problems or plan ahead. It’s built for fast-moving teams who want real answers, not more dashboards.
From identifying functions that are over budget to tracking how spans of control evolve over time, Agentnoon helps you spot inefficiencies before they become issues. You can also assess how growth plans impact cost, structure, and reporting layers - all in one place. It's people analytics that connects to actual organizational design, not just headcount metrics.
Effective workforce planning strategy requires understanding not just how many people you need - but where, why, and at what cost. Agentnoon links workforce analytics directly to org structure so you can test what-if scenarios, monitor impact, and align structure with business goals as they evolve.
Most workforce analytics software give you dashboards; Agentnoon gives you context. Because it’s built around your live org structure, you don’t have to stitch together data from different platforms to understand what’s going on. It becomes the single place where workforce, structure, and strategy meet.
