Org Chart
Save time making org charts
Visualize all your people data in one place and gain clarity on reporting lines, and workforce insights using dynamic charts
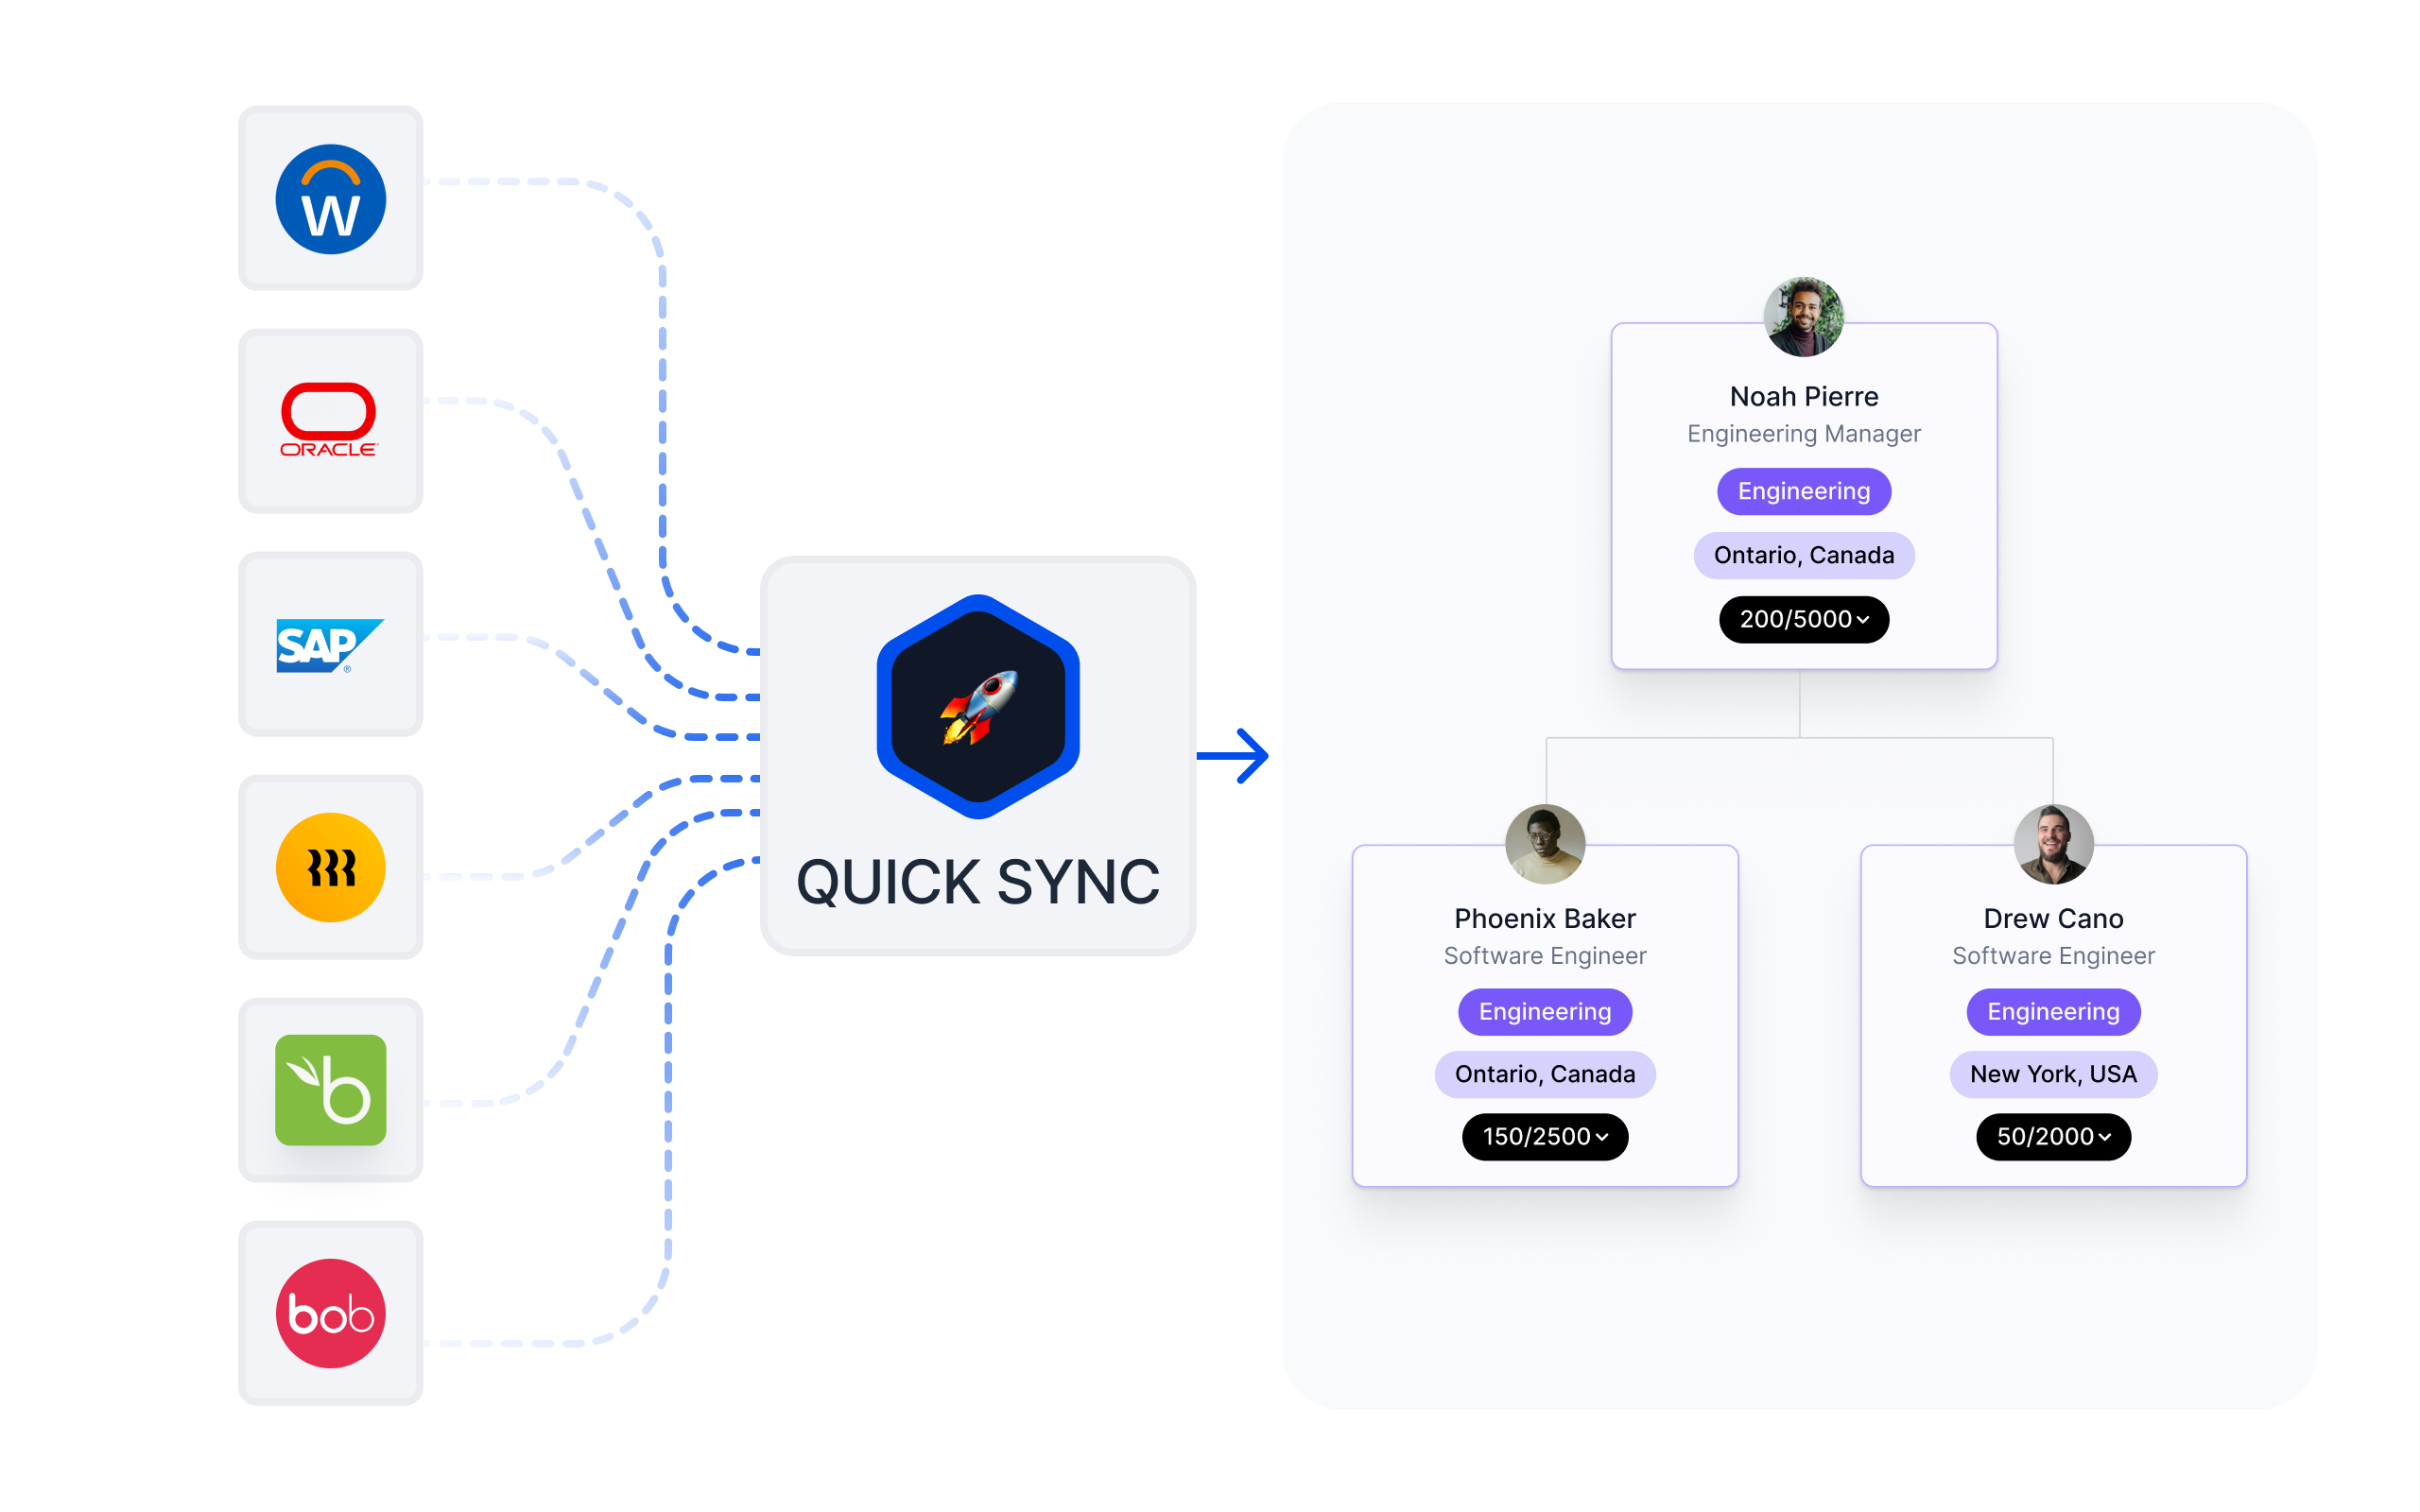
Live integration
Real time updates
Skip manual updates with live integrations to 100+ HRIS. Real-time org charts reflect workforce changes instantly. Ditch outdated drawing tools and spreadsheets for good.
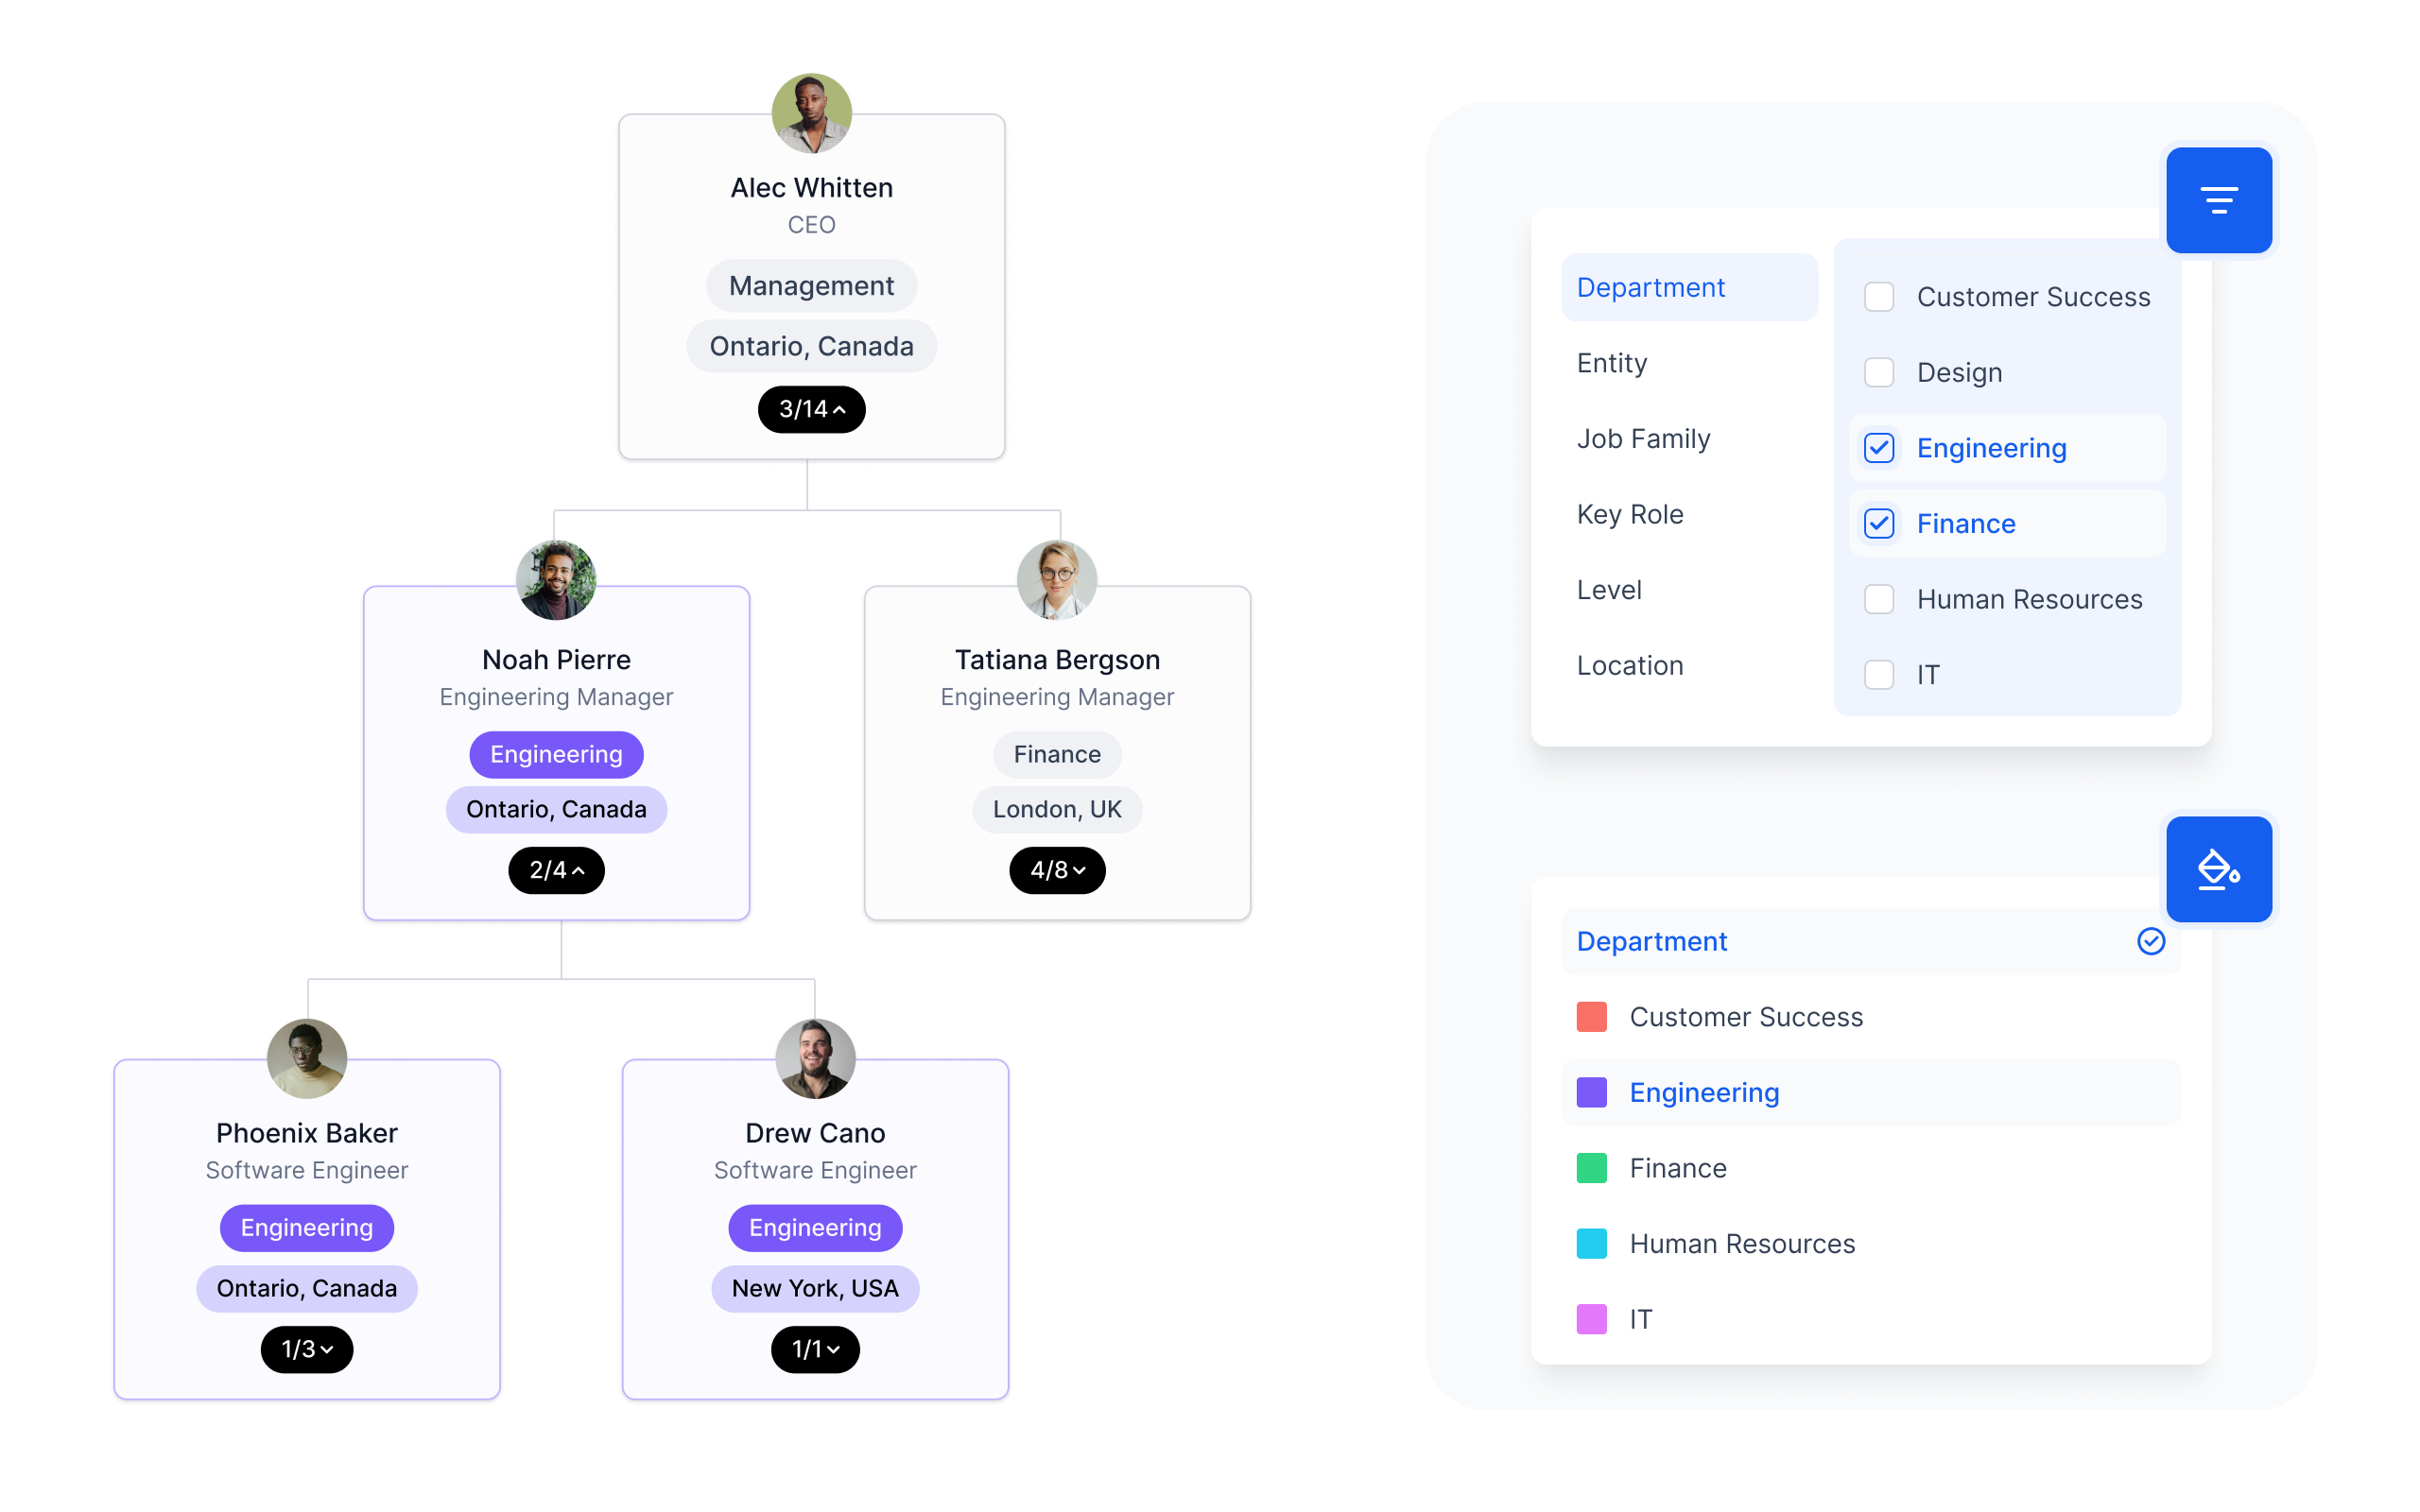
Refine Focus
Highlight what’s important
Use colors, filters, and custom attributes to distinguish teams, roles, or reporting lines. Tailor views to your needs for clearer hierarchy, better planning, and a more dynamic org chart.
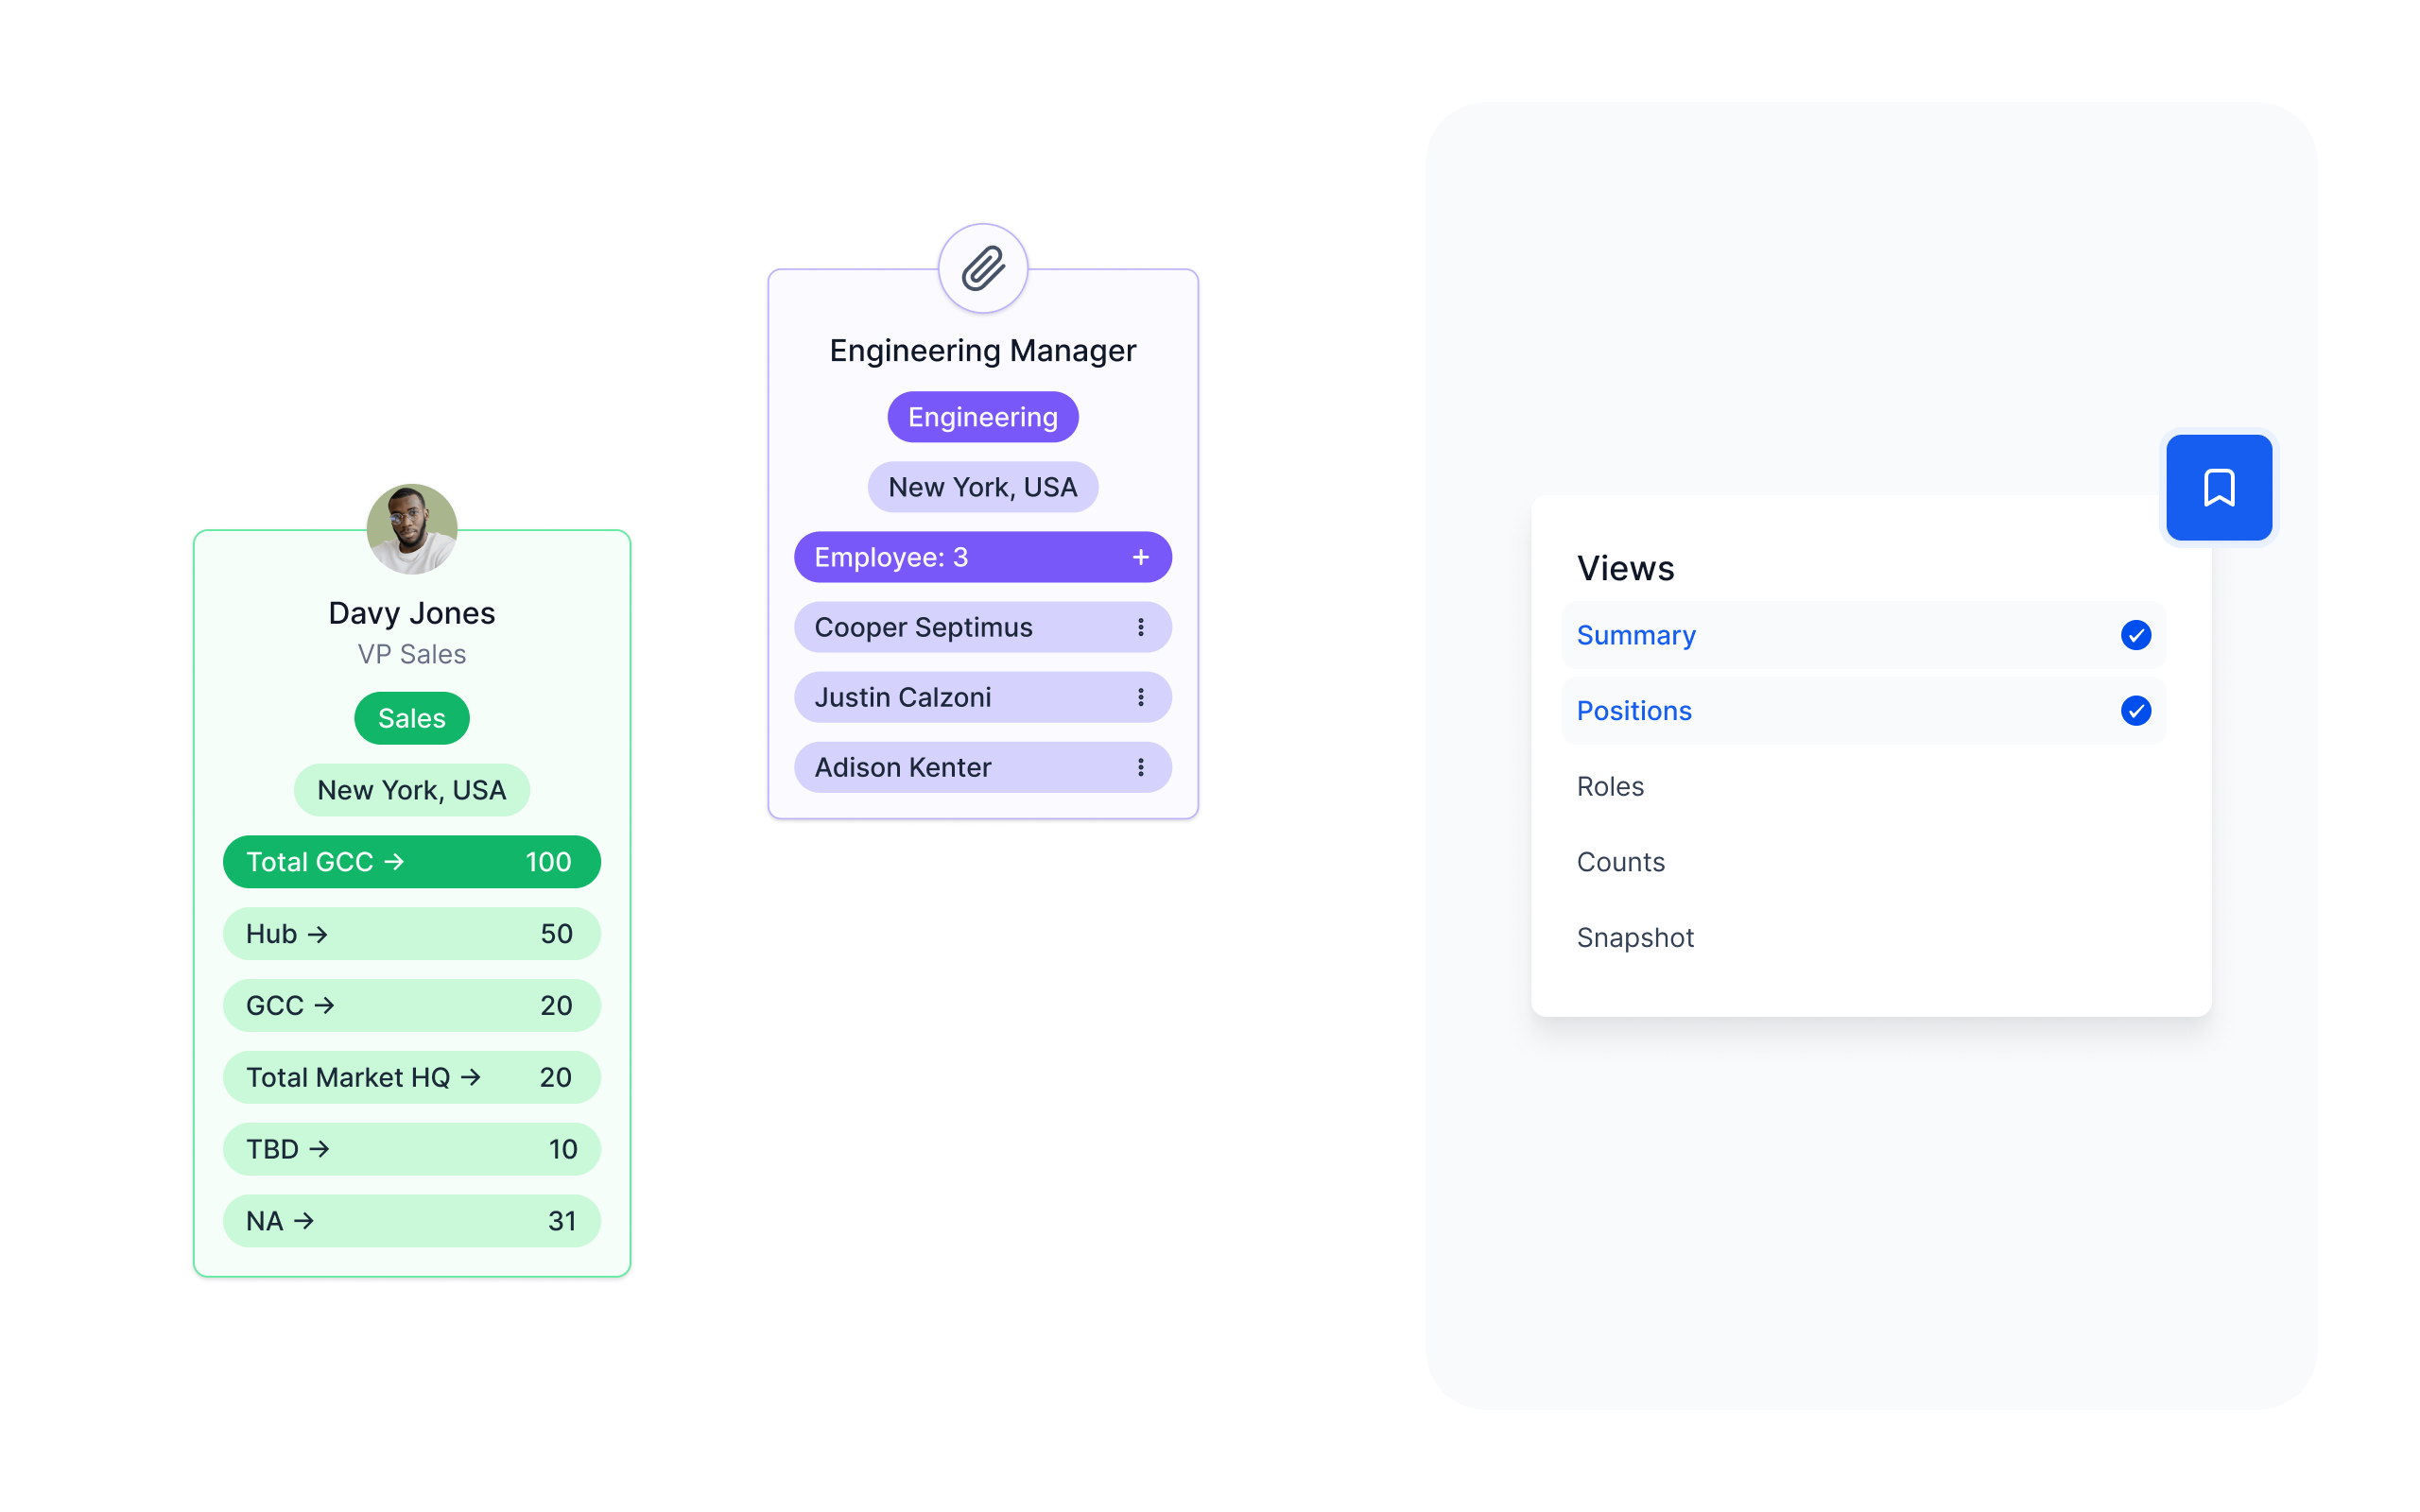
Summary Views
Don't miss crucial details
Get quick summaries of your workforce with count views, group-by options, and an overall snapshot. Shift between positions or roles and visualize metrics like salaries and costs from a manager’s perspective - in one flexible layout.
FAQs
Organizational Chart
Org chart visualization helps leadership make smarter decisions by showing more than just hierarchy. With the right org chart software, you can:
Identify teams that are stretched too thin or overly layered
Pinpoint gaps in reporting or role coverage
Compare current vs. planned structures to support growth
Align your headcount strategy with business goals
Agentnoon’s org chart software gives you a clear, real-time view of your organization’s structure - so you’re not planning in the dark or relying on outdated charts when it’s time to scale or restructure.
Yes. Agentnoon offers fully customizable organizational charts - adjust layouts, apply filters, color-code roles, or show only relevant teams. You can even customize views for HR, Finance, or leadership so each stakeholder sees exactly what they need.
Agentnoon’s org chart software goes beyond reporting lines - it helps you understand, analyze, and plan your organization’s structure in real time. Key capabilities include:
Real-Time Data Integration: Seamlessly syncs with over 100 HRIS platforms and Google Sheets, ensuring your org chart reflects the most current organizational structure.
Interactive Visualization: Offers dynamic, zoomable charts that allow users to explore complex hierarchies and team structures with ease.
Customizable Views: Create custom org charts views by department, role, location, or other custom fields to suit various stakeholder needs.
Advanced Analytics: Provides insights into spans of control, management layers, and team distributions, aiding in strategic planning and decision-making.
Export Options: Easily export org charts to PowerPoint, PDF, or CSV formats for presentations and reporting.
Collaboration: Supports real-time collaboration, allowing multiple users to edit and review org charts simultaneously.
Agentnoon is a powerful tool for organizations seeking to visualize and manage their structures effectively.
The best organizational chart software should do more than just depict reporting lines; it should provide actionable insights into your organization's structure and dynamics.
Agentnoon turns your org chart into a live planning system with capabilities like:
Interactive Visualization:
Visualize your entire org - no matter how complex. Drill-down into specific functions, spotlight key roles, and switch between different views without losing context.Customizable Views: Tailor org charts by department, role, or location to suit various stakeholders.
Real-Time Data Sync: Ensure your org chart reflects the latest organizational changes by integrating seamlessly with HRIS platforms.
Advanced Analytics: Gain insights into team structures, identify gaps, and plan for growth with built-in analytics tools.
AI-Powered Org Chart Insights:
Agentnoon Intelligence surfaces structural inefficiencies - like span overloads, missing reporting links, or excessive hierarchy depth -so you can take action early.
Unlike traditional tools that offer static representations, Agentnoon’s org chart is dynamic, data-driven, and built for real-time planning, analysis, and collaboration.
Thanks to real-time integration with 100+ HRIS systems, Agentnoon's organizational chart automatically reflects changes like new hires, role updates, or reporting line shifts. Unlike traditional org chart templates or static tools, Agentnoon's org chart is dynamic. No manual updating required - just live data, always in sync.
